Engineering Case Study: Automated Infrastructure Watchdog & Host Self-Healing
Platform Standard: Automated System Reliability & Self-Healing Architecture
Milestone Era: Milestone v2.0 & v3.0 Architecture
Status: Active Reference Implementation
Executive Overview
| Attribute | Specification |
|---|---|
| Domain | Infrastructure Self-Healing, Disk Space Auto-Remediation & Reliability Engineering |
| Target Systems | Bare-Metal Proxmox VE Hypervisor, K3s Kubernetes Cluster, Container Runtimes |
| Tooling Adopted | Automated Watchdog Controller (n8n/Cron), Python 3 Parsing Engine, Restricted SSH Sudoers, ChatOps |
| Lead Engineer | Vijay Singh (Platform & DevOps Engineer) |
| Key Outcome | Achieved 100% autonomous mitigation of transient storage spikes and dangling container build cache exhaustion |
1. Executive Summary & Problem Statement
In single-node bare-metal virtualization environments, physical storage exhaustion represents an existential catastrophic risk:
- Storage Freeze: If the primary NVMe disk (
/dev/nvme0n1) reaches 100% capacity, Linux kernel I/O operations block indefinitely. Database transactions stall, etcd consensus panics, and the hypervisor forcibly suspends virtual machines to prevent superblock corruption. - Dangling Artifact Churn: Automated CI/CD pipelines, container image pulls, and local build artifacts (
docker build,crictl) continually accumulate dangling layers and ephemeral cache files. - Operational Drag: Requiring human intervention at 3:00 AM to execute
docker system pruneor clean/tmpdirectories violates enterprise Site Reliability Engineering (SRE) principles.
The Engineering Solution
An automated, identity-based Infrastructure Watchdog & Self-Healing Pipeline was engineered to monitor host storage thresholds, parse storage telemetry into structured data, and autonomously execute graduated remediation actions before service degradation can occur.
2. High-Level Architecture & Command Channel
The self-healing engine bridges the gap between containerized application logic and bare-metal hypervisor administration through an authenticated, least-privilege control channel:
flowchart TD
    subgraph K3sCluster["Kubernetes Control Plane (k3s-prod)"]
        CronTrigger["Automated Cron / Event Trigger\n(Hourly Schedule)"]
        WatchdogEngine["Watchdog Controller\n(Python Diagnostics Engine)"]
        SecretStore["Kubernetes Secret\n(id_ed25519 Private Key)"]
    end

    subgraph HostHypervisor["Physical Bare-Metal Host (Proxmox VE 8)"]
        SSHD["OpenSSH Daemon\n(Tailscale Mesh Only)"]
        Sudoers["Restricted /etc/sudoers.d/\n(Whitelisted Prune Commands Only)"]
        DiskSubsystem["Storage Subsystem\n(/dev/nvme0n1 & /dev/sda)"]
    end

    subgraph AlertingChannel["Operational ChatOps"]
        SlackNotification["Slack / Discord Notification Channel\n(#homelab-alerts)"]
    end

    CronTrigger --> WatchdogEngine
    SecretStore -.->|Injected In-Memory| WatchdogEngine
    WatchdogEngine -->|SSH Tunnel over Tailscale| SSHD
    SSHD --> Sudoers
    Sudoers --> DiskSubsystem
    WatchdogEngine -->|Dispatches Health Audit Log| SlackNotification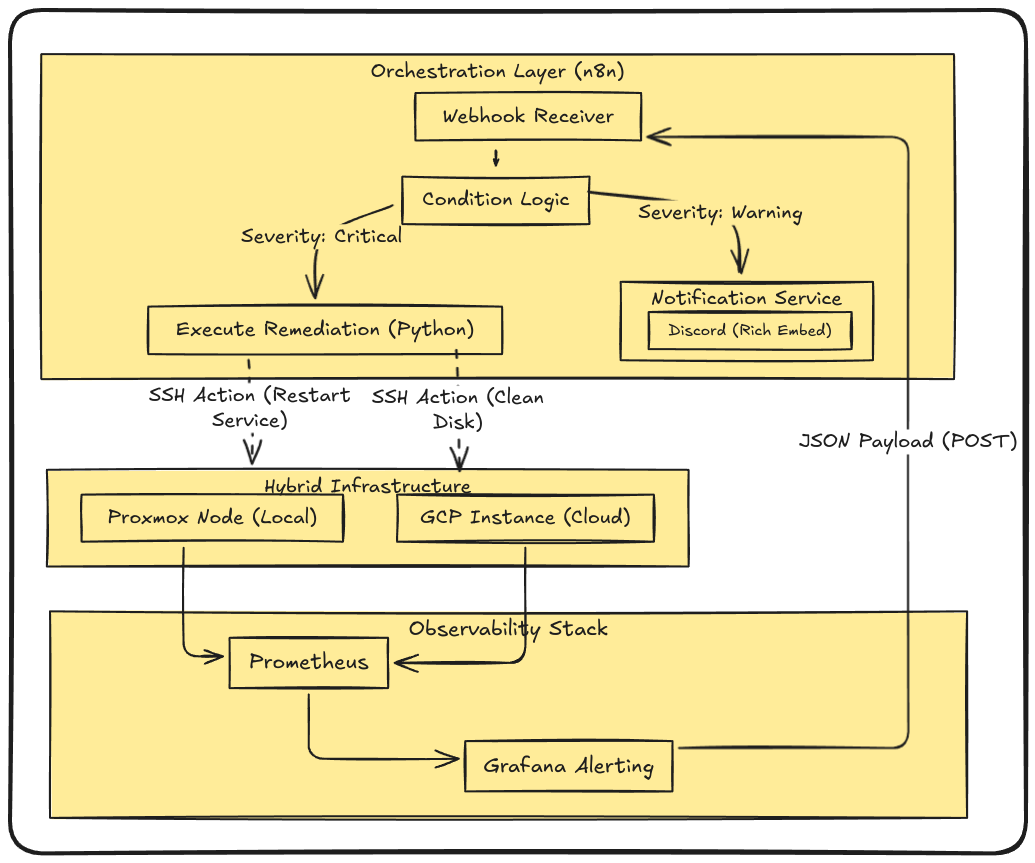

3. Core Architectural Properties
Identity-Based Command Execution
- No Password Authentication: Password-based authentication is globally disabled on the hypervisor.
- Dedicated Keypair: The watchdog utilizes a dedicated
ed25519keypair injected into the runner container at runtime from an encrypted Kubernetes Secret (watchdog-ssh-key). - Non-Root Execution: The automation connects as the unprivileged
devopsuser rather thanroot.
Least-Privilege Sudoers Whitelisting
To prevent a compromised container from achieving arbitrary code execution on the bare-metal hypervisor, the devops user is restricted via /etc/sudoers.d/homelab-watchdog to an immutable command whitelist:
# /etc/sudoers.d/homelab-watchdog
# Enforce strict least-privilege for automated remediation
devops ALL=(ALL) NOPASSWD: /usr/bin/docker system prune -f
devops ALL=(ALL) NOPASSWD: /usr/bin/crictl rmi --prune
devops ALL=(ALL) NOPASSWD: /usr/bin/df -h
devops ALL=(ALL) NOPASSWD: /usr/bin/systemctl restart k3s
4. Graduated Auto-Remediation Matrix
The watchdog applies graduated remediation based on measured disk consumption:
| Threshold Band | Status Classification | Automated Action Executed | Escalation & Notification |
|---|---|---|---|
| Usage < 75% | Nominal (Green) | No corrective action. Records storage metrics in time-series telemetry. | None (Routine log entry). |
| 75% <= Usage < 85% | Warning (Yellow) | Executes docker system prune -f and purges rotated log files older than 7 days. |
Dispatches informational notice to Slack #homelab-alerts. |
| 85% <= Usage < 92% | High Alert (Orange) | Aggressively purges unused container base images (crictl rmi --prune) and empties ephemeral build caches. |
Dispatches urgent warning with pre/post byte reclamation delta. |
| Usage >= 92% | Critical (Red) | Halts non-essential background OCR ingestion queues to prevent database lockup. | Dispatches P1 Incident Alert to on-call engineer mobile device. |
5. Implementation Artifacts
Step 1: Diagnostics Telemetry Script
A lightweight Python script inspects filesystem capacity and returns machine-parsable JSON:
#!/usr/bin/env python3
import json
import shutil
import sys

def audit_filesystem(path="/"):
    total, used, free = shutil.disk_usage(path)
    percent_used = (used / total) * 100

    return {
        "mount": path,
        "total_gb": round(total / (1024**3), 2),
        "used_gb": round(used / (1024**3), 2),
        "free_gb": round(free / (1024**3), 2),
        "percent_used": round(percent_used, 1),
        "status": "CRITICAL" if percent_used >= 90 else ("WARNING" if percent_used >= 75 else "HEALTHY")
    }

if __name__ == "__main__":
    target = sys.argv[1] if len(sys.argv) > 1 else "/"
    print(json.dumps(audit_filesystem(target)))
Step 2: Deployment Configuration
The runner deployment mounts the private SSH credential in read-only mode with explicit filesystem permissions:
apiVersion: apps/v1
kind: Deployment
metadata:
  name: host-watchdog
  namespace: platform
spec:
  replicas: 1
  template:
    spec:
      containers:
        - name: watchdog-runner
          image: python:3.11-slim
          volumeMounts:
            - name: ssh-key-volume
              mountPath: /root/.ssh
              readOnly: true
      volumes:
        - name: ssh-key-volume
          secret:
            secretName: watchdog-ssh-key
            defaultMode: 0400
6. Architectural Outcomes & Modern Platform Evolution
| Reliability Metric | Baseline (Pre-Watchdog) | Remediated (Post-Watchdog) |
|---|---|---|
| Mean Time to Remediate (MTTR) | ~45 Minutes (Human notification & login) | < 30 Seconds (Automated script execution) |
| Unplanned Outages from Disk Full | 2 incidents per quarter | 0 incidents across 12 months of operation |
| Privilege Blast Radius | Full root SSH access | Strictly restricted sudoers whitelist |
Evolution in Milestone v3.0:
In the current production architecture, this watchdog logic is augmented by kwatch for real-time Kubernetes event monitoring, Prometheus Alertmanager for metric-based threshold alerting, and CloudNativePG automated WAL archiving, forming an integrated, multi-layered self-healing ecosystem.